Logging and visualization support for MPI programs is provided with the MPE (MPI Programming Environment) software. The logging library provided with MPE tracks all MPI calls and saves the information to a log file that can be visualized.
When a program is linked with the MPE libraries, you will see a bit of extra output at the end that shows the logfile being written out.
[amit@localhost token-ring]: mpiexec -n 4 token_ring_mpi
Pass a token through the   4 id ring:
     0 ->      1 ->      2 ->      3 ->      0
received token ring on 1 from 0
received token ring on 2 from 1
received token ring on 3 from 2
token ring done
...
Writing logfile....
Enabling the Default clock synchronization...
Finished writing logfile token_ring_mpi.clog2.
[amit@localhost token-ring]
After the program finishes, then there will be a log file created with the
exntensiom clog2. Start the jumpshot program on
this file as follows:
jumpshot token_ring_clog2
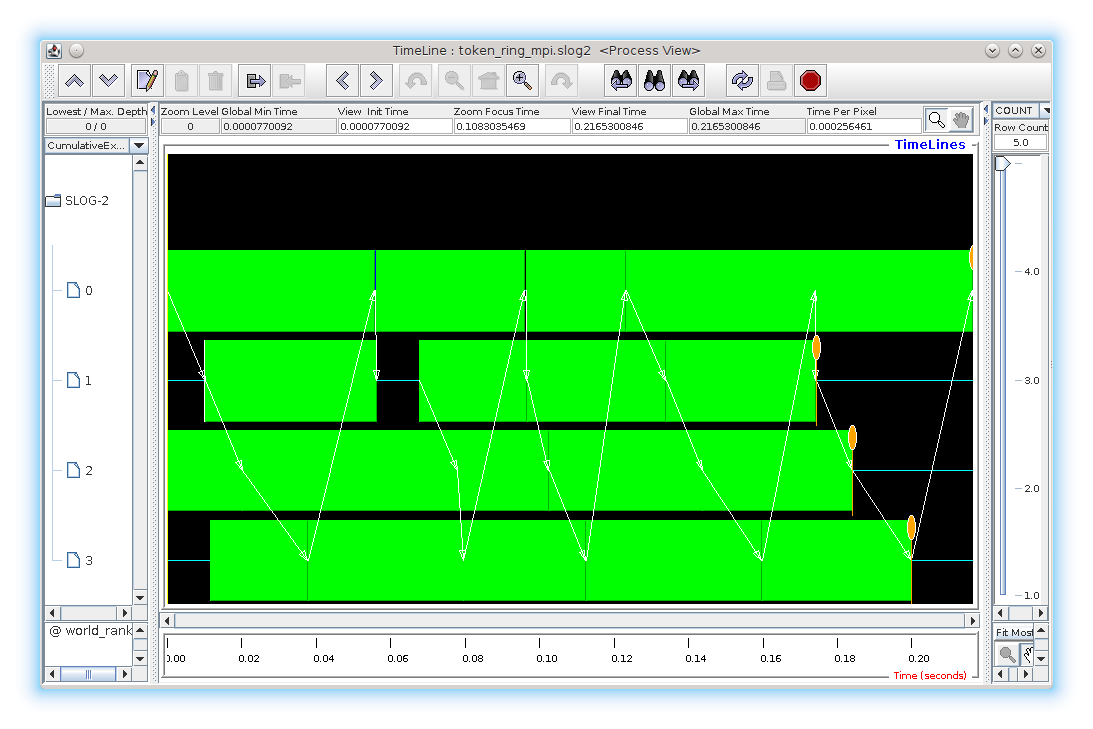
and follow directions from the program. Figure 1 shows a sample
visualization.